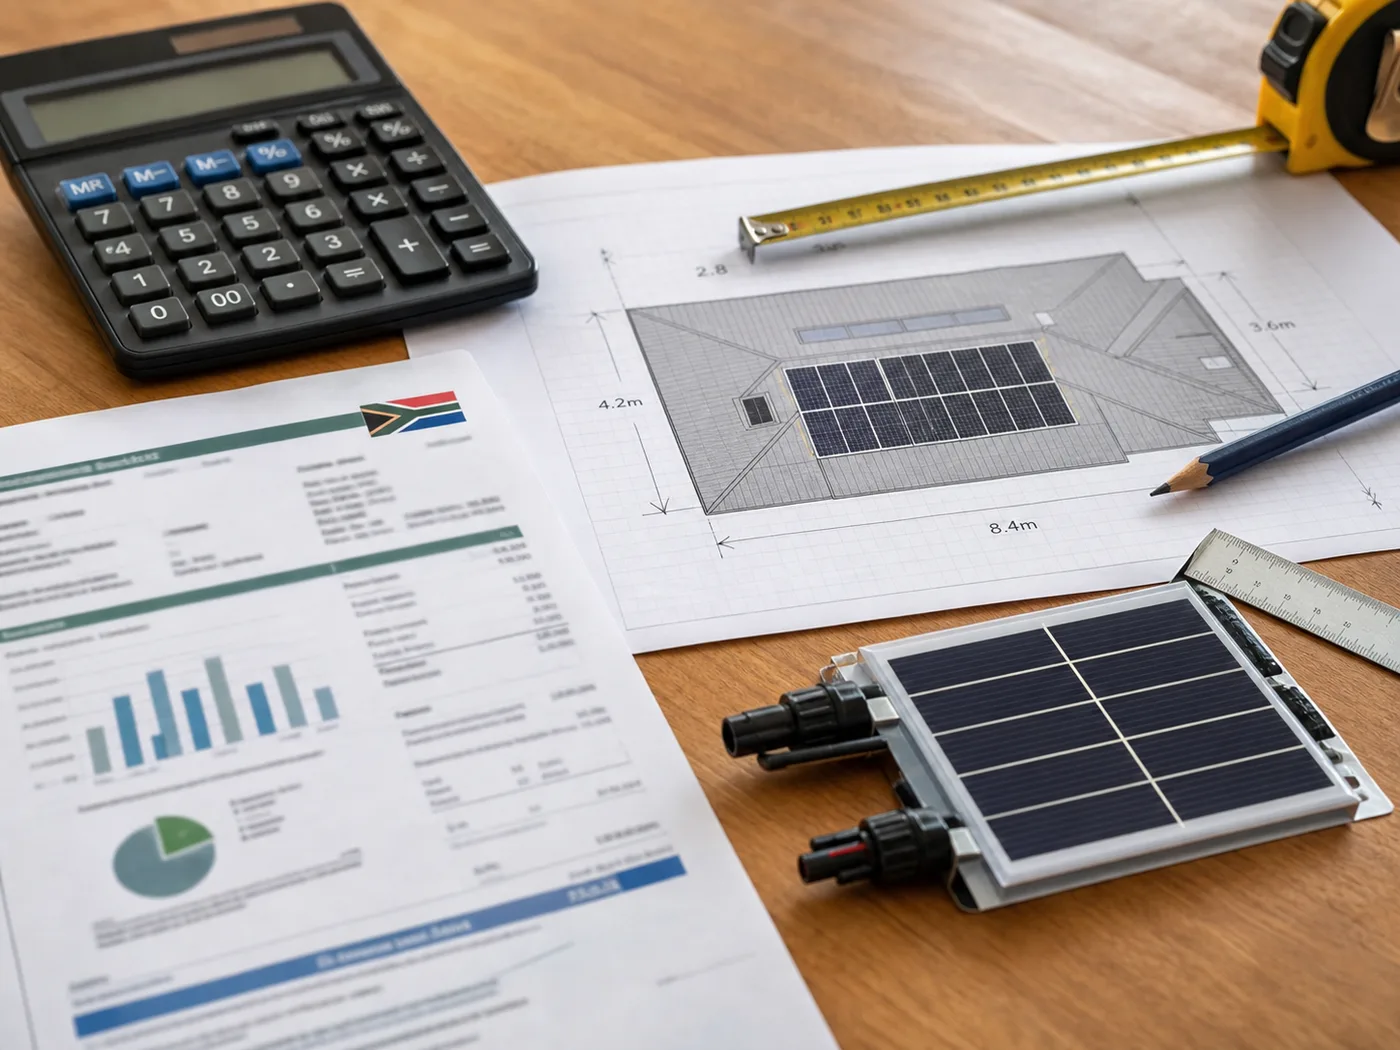
The same system can look very different as an outright purchase, rent-to-own plan or subscription. Compare the published package structures before you request a tailored quote.
Solar payback is the time required for cumulative electricity savings to recover the net installed cost of the system. A R100,000 system saving R18,000 in the first year has a simple payback of 5.6 years if the saving never changes.
That shortcut is useful, but South African payback estimates need more detail. Tariffs rise, panels slowly degrade, fixed grid charges remain, batteries may need replacement, exported electricity may earn less than imported electricity costs, and finance adds fees or interest.
Payback formula
Simple payback = net installed cost ÷ first-year net electricity saving
Use net savings after remaining grid purchases, fixed charges, maintenance and expected replacement reserves.
A worked South African payback example
Assume:
installed cash price: R100,000;
first-year electricity saving: R18,000;
annual electricity-price increase: 8%;
annual panel-output degradation: 0.5%; and
no maintenance, replacement, export income or discount rate in this first illustration.
The flat simple payback is R100,000 ÷ R18,000 = 5.6 years.
If the avoided tariff rises 8% a year while output falls 0.5% a year, the illustrative savings develop like this:
Year
Annual saving
Cumulative saving
1
R18,000
R18,000
2
R19,343
R37,343
3
R20,786
R58,129
4
R22,336
R80,465
5
R24,003
R104,468
On those assumptions, payback occurs late in year five. That result is not a market average. Change the load profile, tariff, system price or self-consumption and the answer changes quickly.
The 8% input is also an illustration rather than your approved tariff. NERSA approved an average 8.76% increase for Eskom direct customers from 1 April 2026 and 9.01% for municipal customers from 1 July 2026, but each tariff category and municipality can produce a different household increase. See the NERSA 2026/27 decision and use the rates on your own bill.
Step 1: calculate the net installed cost
Include every amount required to put a compliant working system into service:
panels, inverter and battery;
mounting, cabling, protection and distribution-board work;
labour and commissioning;
electrical Certificate of Compliance;
design, municipal application and meter costs where applicable;
finance initiation or legal fees if you are measuring financed payback; and
VAT where it is not recoverable.
Subtract a rebate only if you genuinely qualify. SARS says the residential section 6C rebate applied to qualifying panels brought into use from 1 March 2023 to 29 February 2024. It is not available for a new household installation in 2026.
A quote should provide expected annual production in kWh, not only inverter size or panel count. Generation depends on array capacity, location, orientation, tilt, shade, losses and downtime.
Ask for the assumptions and a monthly production profile. A single annual total can hide weak winter output or midday surplus that the home cannot use.
Panel degradation belongs in a long-term model. Use the product warranty's stated performance path rather than inserting a generic percentage if the exact panels are known.
Step 3: estimate self-consumption
Self-consumption is the solar energy used directly in the home or stored and used later. It is normally worth more than exported energy because it avoids buying a unit at the retail tariff.
For example, a system may generate 7,000kWh a year, but that does not mean it replaces 7,000kWh of billed imports. Some production may be curtailed, exported for a lower credit or lost in battery and inverter conversion.
Improve self-consumption by moving flexible loads such as the pool pump, washing machine, dishwasher and geyser heating into solar hours. Do not move loads beyond the inverter or battery's operating limits.
Take the variable energy charge from the actual municipal or Eskom tariff, including VAT where applicable. Do not multiply solar generation by the whole bill divided by kWh if the bill contains fixed network, service or capacity charges that remain after installation.
Time-of-use customers need separate peak, standard and off-peak values. A battery may create value by shifting energy into an expensive period, but conversion losses and operating limits apply.
If the system exports, model the credit separately. Net billing usually credits exports at a different rate from imports and can include fixed fees. Read our net billing and feed-in tariff guide before counting exported units at the retail price.
Step 5: subtract recurring and replacement costs
Include costs that the sales illustration may omit:
insurance premium or excess;
monitoring or connectivity charges;
cleaning and inspection where needed;
call-outs and labour outside warranty;
inverter repair or replacement reserve; and
battery replacement if your model extends beyond its expected warranted service.
A panel performance warranty is not a whole-system guarantee. Batteries and inverters have different warranty periods, cycle limits and exclusions. See solar warranties compared and lithium battery lifespan.
Step 6: decide which payback measure you mean
Simple payback
Simple payback divides cost by annual saving. It is easy to understand and useful for comparing similar cash purchases, but ignores the timing of future money.
Escalated payback
Escalated payback updates savings each year for tariff changes, output degradation and operating costs. The worked example above uses this method.
Discounted payback
Discounted payback reduces future savings to today's value using a chosen discount rate. It asks whether money tied up in solar is repaid after considering an alternative return or cost of capital. This is the more conservative investment measure.
Net present value and internal rate of return
NPV adds the present value of every future net cash flow and subtracts the initial cost. A positive NPV at your chosen discount rate indicates value under those assumptions. IRR is the discount rate that makes NPV zero. Both are more informative than payback for comparing a 15 or 20-year asset with another investment.
How financing changes payback
A financed system does not have an instant payback merely because the first payment is lower than the old electricity bill. The finance creates a liability and changes the cash-flow schedule.
For a loan or home-loan draw, include interest and fees. You can measure:
project payback using the cash installed price and energy performance; and
household cash-flow break-even using deposits, repayments, remaining grid bills and service costs.
Keep both results. Project payback tells you whether the equipment economics work. Cash-flow break-even tells you whether the funding structure is affordable.
For rent-to-own, include annual escalation, initiation charges and the final buyout. For a subscription, the customer does not automatically acquire an asset, so "asset payback" is the wrong measure. Compare cumulative subscription fees with cumulative bill savings and the value of included service.
Conservative: lower generation and self-consumption, modest tariff growth, full operating costs and an earlier battery replacement.
Central: installer production estimate adjusted for your load profile and current published tariffs.
Upside: stronger self-consumption and higher tariff growth, without assuming impossible bill elimination.
If the purchase is affordable only in the upside case, the design or finance is too fragile. Use the conservative case for debt affordability and the central case for planning.
Free planning tool
Solar finance and payback calculator
Compare cash payback with a financed system, using your own bill, tariff and assumptions.
R 2 500
R 110 000
70%
Payment route
Cash payback
5.2 years
20-year net saving
R 851 001
Year-one saving
R 1 750/mo
Estimated array
4.4 kW
About 8 × 550 W panels
Roughly 23.3 m² of usable roof
Indicative scenario only. It excludes finance fees, tax effects, maintenance, export credits and site-specific generation. The assumptions are visible below so the result can be challenged instead of treated as a quote.
How long does solar take to pay for itself in South Africa?
There is no credible national number for every home. Divide net installed cost by first-year net savings for a simple estimate, then model tariff changes, degradation, fixed charges and replacements. A R100,000 system saving R18,000 initially has a flat simple payback of 5.6 years.
What electricity-price increase should I use?
Use a range rather than one certainty. NERSA approved average increases of 8.76% for Eskom direct customers and 9.01% for municipal customers for the relevant 2026/27 implementation dates, but your tariff category may differ.
Does a battery improve solar payback?
A battery can raise self-consumption and shift energy into expensive or outage periods. It also adds cost, conversion losses and eventual replacement risk. Its financial return depends on the load profile and tariff, while its backup value is a separate household benefit.
Does financing make payback longer?
Interest, fees and escalation increase the total funding cost, but financing changes the timing of payments. Calculate project payback and household cash flow separately rather than declaring an immediate payback from a low first instalment.
Can a solar provider guarantee savings?
A provider can guarantee specific contractual outcomes only if the agreement defines the baseline, calculation and remedy. Future weather, tariffs and household usage cannot be known exactly. Ask for assumptions and a sensitivity range.
How does SolarGuide make money?
SolarGuide currently earns referral fees from eligible Alumo quote requests. The calculator and worked example are educational estimates, not financial advice or a savings guarantee. Tariff information was checked against NERSA's published 2026/27 decision on 20 September 2026. Request an Alumo quote.
SolarGuide is an independent referral partner. We help you compare options and arrange a free quote — Alumo supplies, installs, finances and warrants the systems. Pricing is indicative, sourced from Alumo’s published catalogue, and subject to a site assessment and credit approval.